This is the paper that cited 7 of our footprint papers and published in OSDI 2014. The main work is to fast derive workload’s miss ratio curve (MRC). The technique adopted in the paper is a data structure called “counter stack”, which, is essentially a extremely huge matrix of size NxN, where N is the trace length. This data structure is contains the footprint (or working set size) of all windows, (not average window size). From the counter stack, stack distances of references can easily be read. So the challenge this paper addresses is to compress the data structure. The paper talked about some optimizations, which includes, sampling (process every dth reference), pruning (“forget” some windows), using probabilistic cardinality estimator (HyperLogLog) to approximate reuse distances. Using stack counters can be used to query many useful informations, like total data footprint, trace length, miss ratio within a given time period and miss ratio composed from multiple workloads.
So first, what is a stack counter? It is a 2-dimensional matrix. When a new reference is made, a new column is inserted to the right side of the matrix. Each entry C_ij represents the amount of distinct elements in the window (i,j). Therefore this matrix contains footprints of all possible windows of the trace.

Having the matrix, to compute MRC also requires a way to identifies the reuse windows. To do so, two more matrices are needed, \delta x and \delta y.
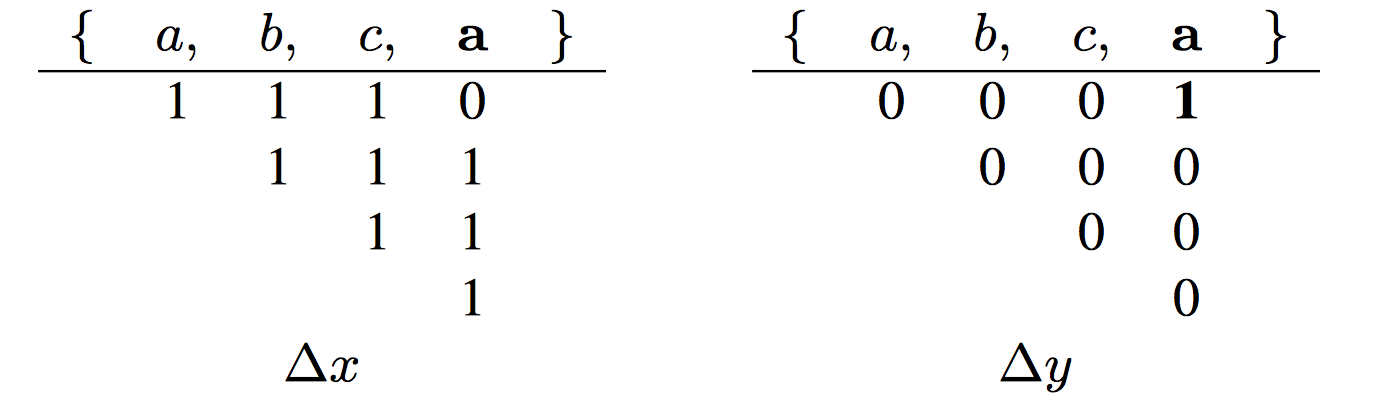
x matrix is the difference of rows of counter stack while y matrix is the difference of rows of x matrix. It seems to me, this differencing operation is “taking directive” in HOTL theory. For the fourth reference in the example trace, the top “1” in the fourth column is at the 1st row, so its last access time is 1.
This is all about counter stack.
To make this data structure practical, there are several approximations presented in the paper.
1. Sampling. A simple approach is to sample every d references. It indicates that the matrix is to be shrinked by a factor of “d”. From the paper, “For large scale workloads with billions of distinct elements, even choosing a very large value of d has negligible impact on the estimated stack distances and MRCs.”
2. Pruning. The observation is that, in x matrix, each rows only contains at most M “1”s, where M is the total footprint. At some point on, the entries in the row will become 0 and remain 0 for the rest of row. Therefore, the paper propose to delete the rows where it has at most M/p different entries than its immediate lower rows. I am not sure how this operation would impact the result and how it can be migrated to our footprint measurement. But, intuitively, this observation, to translate into footprint theory, means larger windows are likely to have most of the data, maintaining large-sized windows at fine granularity is waste.
3. Using probabilistic cardinality estimator. Counter stack needs to counts the amount of data it has seen. It can keep records for all the data using hash table and count the size of the table. It is too expensive. Bloom filter is an option, but “the space would still be prohibitively large”. (I don’t know why…) Therefore, they choose a probabilistic counter or cardinality estimator, called “HyperLogLog“. The memory usage is roughly logarithmic in M with more accurate counters requiring more space.
4. Due to above approximations, the form of \delta x and \delta y matrices is different from shown above. The authors proved a theorem to bound the error by total footprint, trace length and two other parameters.
Counter stack has benefits over stack distance (reuse distance). It has time information. From counter stack, the MRC for any time period can be read by slicing the counter stack. Counter stacks are also composable, because it is essentially “footprint”. However, it still has not solved the problem of interleaving and data sharing. Composing two counter stacks requires alignment beforehand. When data is shared across traces, composition becomes almost impossible.
Above is all technical details about counter stacks. The authors also have some interesting observations about their workloads using counter stack in the paper.

Footprint analysis has been extended to measure phase behavior in Wang et al. CCGrid 2015, using adaptive bursty footprint (ABF) sampling.